




Заголовок: Precision Интегрирующая сфера Spectrometer for Accurate LED and Light Source Measurement: Theoretical Foundation, System Architecture, and Industrial Implementation
Абстрактный
The evolution of solid-state lighting and the increasing complexity of photometric requirements across industries necessitate measurement systems that combine high spectral resolution with total flux accuracy. The Precision Integrating Sphere Spectrometer, exemplified by the ЛИСУН LPCE-2 and LPCE-3 systems, addresses the dual demands of spectral fidelity and spatial integration. This article delineates the physical principles underlying integrating sphere-based spectroradiometry, the architectural distinctions between the LPCE-2 and LPCE-3, and their application across high-stakes sectors including automotive lighting, aerospace, medical devices, and photovoltaics. The discussion is anchored in metrological standards such as CIE 127, LM-80, and IESNA LM-79, with quantitative analysis of measurement uncertainty, stray light correction algorithms, and sphere coating degradation models.
1. Metrological Imperatives in Solid-State Light Source Characterization
The spectral power distribution (SPD) of an LED is not governed solely by bandgap engineering; manufacturing variances in phosphor deposition, die temperature, and driver ripple introduce deviations that cannot be captured by a photopic filter-based photometer. For industries where chromaticity tolerances fall below 0.002 in CIE (u’v’) coordinates—such as automotive forward lighting or medical endoscopy illumination—spectroradiometric methods are mandatory.
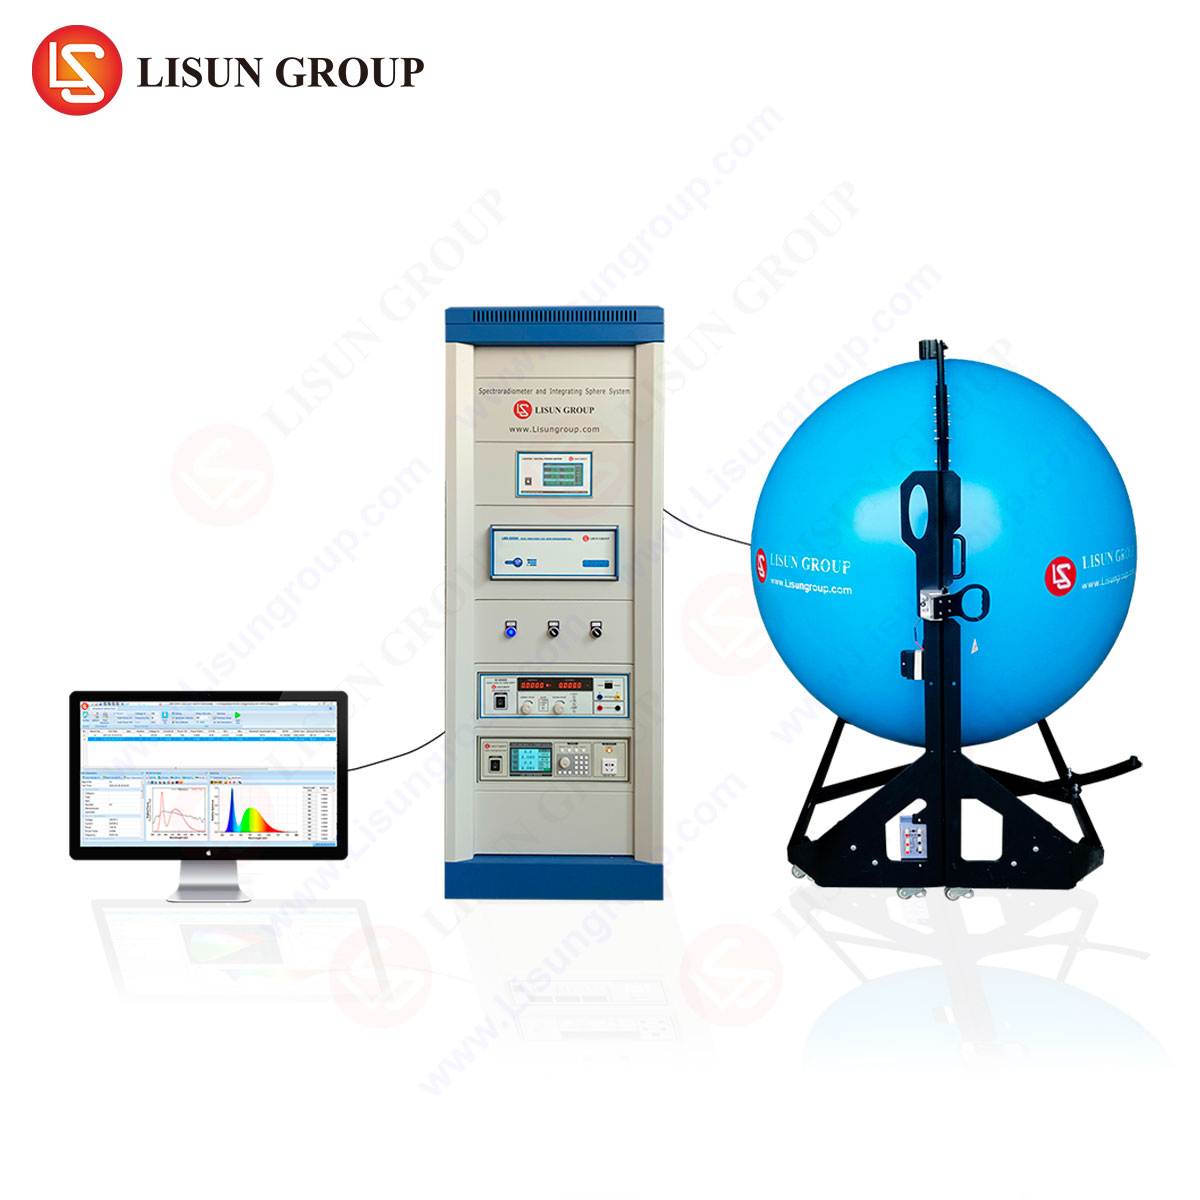
The integrating sphere spectrometer solves the fundamental conflict between angular integration and spectral resolution. By collecting luminous flux omni-directionally via a high-reflectance (typically BaSO₄ or PTFE) coating, the sphere provides a spatially uniform radiance at the detector port. The attached spectroradiometer then resolves this integrated radiant flux across the wavelength domain (typically 350 nm to 1100 nm). This dual integration—spatial through the sphere, spectral through the grating—yields the total spectral radiant flux (Phi_e(lambda)), from which all photometric, colorimetric, and radiometric quantities are derived.
2. Architectural Distinctions: The LISUN LPCE-2 and LPCE-3 Systems
The LISUN LPCE-2 and LPCE-3 represent two tiers of precision instrumentation, differentiated primarily by sphere diameter, detector array technology, and dynamic range management.
2.1 LISUN LPCE-2: High-Fidelity Spectral Analysis for Research and Compliance Testing
The LPCE-2 employs a 0.3-meter or 0.5-meter integrating sphere (user-configurable) coated with diffuse PTFE, achieving (rho(lambda) > 96%) from 380 nm to 780 nm, with a spatial uniformity of (pm 0.2%). The spectroradiometer utilizes a CMOS linear array detector with 2048 pixels, yielding a spectral resolution of 2.0 nm (FWHM) and a wavelength accuracy of (pm 0.3) nm. The system covers a dynamic measurement range from 0.1 lux to 200,000 lux, enabling characterization from low-level indicator LEDs to high-brightness white-light sources.
2.2 LISUN LPCE-3: Extended Capabilities for High-Power and NIR Applications
The LPCE-3 enlarges the sphere diameter to 1.0 m (or 1.5 m optional) and integrates a back-thinned CCD sensor for enhanced sensitivity in the near-infrared (NIR) region up to 1100 nm. This is critical for photovoltaic spectral response matching and for characterizing laser-driven phosphor sources found in cinema projection. The system incorporates an auxiliary lamp channel for sphere self-absorption correction—a necessity when measuring large-form-factor luminaires that occlude significant sphere wall area. A built-in temperature control stage ((25^circ text{C} pm 0.5^circ text{C})) for the detector head reduces dark-current drift to <0.002% of full scale per hour.
Table 1: Comparative Specifications of LISUN LPCE-2 and LPCE-3
| Параметр | LPCE-2 | LPCE-3 |
|---|---|---|
| Sphere diameter | 0.3 m / 0.5 m | 1.0 m / 1.5 m |
| Spectral range | 350–850 nm | 350–1100 nm |
| Detector array | 2048-pixel CMOS | 2048-pixel back-thinned CCD |
| Wavelength accuracy | (pm 0.3) nm | (pm 0.2) nm |
| Stray light rejection | (1 times 10^{-4}) (at 635 nm) | (5 times 10^{-5}) (at 635 nm) |
| Maximum luminance | 200,000 cd/m² | 500,000 cd/m² |
| Self-absorption correction | Manual | Automatic (auxiliary lamp) |
3. Calibration Methodology and Traceability for Flux and Chromaticity
The measurement chain for an integrating sphere spectrometer begins with a calibration standard—typically a tungsten halogen lamp with a known spectral radiance traceable to a national metrology institute (e.g., NIST, PTB). The system is calibrated in two steps: first, a spectral calibration using a low-pressure argon or mercury-argon source to assign wavelength-to-pixel mapping; second, an absolute irradiance calibration using the standard lamp.
For luminous flux measurement, the sphere is calibrated using a reference flux standard. The total flux (Phi_v) is calculated as:
[
Phi_v = Km int{380}^{780} Phi_e(lambda) V(lambda) dlambda
]
where (V(lambda)) is the CIE 1924 photopic luminosity function and (Km = 683 , text{lm/W}). The LPCE-3’s automatic self-absorption correction routine measures the sphere response with and without the test luminaire present, applying a correction factor (C(lambda) = R{text{empty}}(lambda) / R_{text{occupied}}(lambda)) to compensate for insertion losses.
4. Cross-Industry Implementation and Use Cases
4.1 Automotive Lighting Testing: Compliance with ECE R112 and R128
Automotive headlamps and signal lamps require chromaticity within specific quadrangles on the CIE 1931 diagram. Using the LPCE-3 with a 1.0 m sphere, an automotive optics laboratory can measure the full SPD of a matrix LED headlamp operating at 70 W and 100,000 cd/m². The goniometric equivalence of the sphere avoids the need for heavy goniophotometers. For turn-signal LEDs (ECE R128), the dominant wavelength shift over temperature is measured by integrating the sphere with a thermal chamber, verifying that the chromaticity drift remains within 3 nm over (-40^circ text{C}) to (+85^circ text{C}).
4.2 Aerospace and Aviation Lighting: Ensuring Photometric Minimums and Chromaticity Bin Stability
Aviation obstruction lights (FAA AC 150/5345-43) demand a minimum intensity of 2,000 cd at specific beam angles. The LPCE-2, paired with a goniometer arm inserted into the sphere port, can measure total flux and, through the sphere’s uniform source radiance, derive the source’s average luminance. For cockpit backlighting in MIL-STD-3009, the chromaticity tolerance is (Delta u’v’ leq 0.004); the LPCE-2’s wavelength accuracy of (pm 0.3) nm ensures compliance verification without ambiguity.
4.3 Medical Lighting Equipment: Spectral Fidelity for Surgical Illumination
In endoscopy and surgical lighting, the color rendering index (CRI) and the R9 value (deep red) are critical for tissue differentiation. A xenon or hybrid LED surgical lamp tested with the LPCE-3 yields a CRI of 95–98. The spectroradiometer’s low stray light floor ((5 times 10^{-5})) ensures that the deep red tail (620–700 nm) is not artificially inflated by background scatter, a common error in lower-tier instruments.
4.4 Photovoltaic Industry: Spectral Mismatch Correction in Solar Simulation
The LPCE-3’s extended NIR capability (350–1100 nm) allows for direct measurement of the spectral mismatch factor (M) used in calibrating reference cells per IEC 60904-3. The system measures the SPD of a solar simulator and calculates:
[
M = frac{int E{text{sim}}(lambda) S{text{ref}}(lambda) dlambda cdot int E{text{AM1.5G}}(lambda) S{text{DUT}}(lambda) dlambda}{int E{text{sim}}(lambda) S{text{DUT}}(lambda) dlambda cdot int E{text{AM1.5G}}(lambda) S{text{ref}}(lambda) dlambda}
]
where (S(lambda)) denotes the spectral responsivity of the reference and device-under-test cells. A mismatch error of (<1%) is achievable with the LPCE-3’s spectral resolution.
4.5 Stage and Studio Lighting: Correlated Color Temperature (CCT) Consistency
Theatrical LED luminaires often mix multiple die colors (e.g., red/green/blue/amber) to produce variable CCT from 2,700 K to 10,000 K. The LPCE-2’s high dynamic range allows measurement at both dimmed (0.1% output) and full brightness without changing gain states, capturing CCT drift due to drive current modulation. The sphere’s Lambertian averaging eliminates errors from non-uniform beam patterns typical of moving-head fixtures.
5. Automated Measurement Protocols for LED and OLED Manufacturing
In high-throughput LED binning, every packaged LED must be measured for luminous flux, dominant wavelength, and forward voltage within 200 ms. The LPCE-2 can be integrated into a pick-and-place tester via its external trigger and RS-232 interface. A typical production protocol involves:
- Pre-heat stabilization: The LED is pulsed at its nominal current for 50 ms to reach thermal quasi-equilibrium.
- Spectral acquisition: 10 sequential spectra are averaged within 80 ms; the spectroradiometer’s electronic shutter eliminates integration-time errors.
- Flux integration: The sphere’s photometric calibration yields flux in lumens.
- Bin assignment: The microcontroller compares dominant wavelength to predetermined bin boundaries and actuates a diverter gate.
For OLED panels in display manufacturing, the LPCE-3 with a custom aperture plate measures angular uniformity by rotating the panel beneath a fixed sphere port. Since OLEDs have Lambertian-like emission, a 1.0 m sphere ensures that the full panel (up to 300 mm diagonal) is measured without vignetting.
6. Stray Light Correction and Uncertainty Budget
A persistent challenge in integrating sphere spectrometry is stray light—photons from one wavelength region scattering into adjacent detector pixels. The LPCE-3 implements a Stray Light Correction Matrix (SLCM) derived from measuring a series of monochromatic lines. The system solves:
[
S{text{corrected}} = mathbf{M}^{-1} cdot S{text{measured}}
]
where (mathbf{M}) is a (n times n) matrix (n = number of pixels) representing the instrument response to a delta function. The correction reduces the inter-wavelength crosstalk from (1 times 10^{-3}) to (<1 times 10^{-5}) in the worst-case scenario (strong blue LED with a weak red tail). The total expanded uncertainty (k=2) for luminous flux measurement is (pm 1.2%) for the LPCE-2 and (pm 0.8%) for the LPCE-3, inclusive of calibration uncertainty, linearity, and reproducibility.
7. Standard Compliance and Industry Endorsement
The LISUN LPCE-2 and LPCE-3 are designed to comply with the following standards:
- IES LM-79-19: Approved method for electrical and photometric measurements of solid-state lighting products.
- CIE 127:2007: Measurement of LEDs—reference conditions for flux and intensity.
- IEC 60068-2-78: Damp heat stability for the sphere coating (85% RH, 85°C, 1000 hours without reflectance degradation >1%).
- SAE J1889 / NHTSA FMVSS 108: Photometric and chromaticity requirements for automotive lighting.
8. FAQ: Precision Integrating Sphere Spectrometer
Q1: Can the LPCE-2 measure the luminous flux of a 1W LED with the same accuracy as a 500W luminaire?
Yes. The LPCE-2’s dual-range integration electronics dynamically adjust the integration time from 0.01 ms to 10 s, achieving a linear response over six orders of magnitude. The dark-current subtraction is performed before each measurement to maintain accuracy at low flux levels.
Q2: How is self-absorption error corrected when measuring large automotive headlamps in a 1.0 m sphere?
The LPCE-3 uses an auxiliary tungsten lamp mounted on the sphere wall. First, the sphere’s spectral response is measured with the auxiliary lamp alone. Then, with the headlamp placed inside the sphere, the auxiliary lamp measurement is repeated. The ratio of these two measurements yields the wavelength-dependent absorption correction factor (C(lambda)), which is applied to the headlamp’s raw emission spectrum.
Q3: What is the recommended recalibration interval for the LPCE-2/3 standard lamp?
The tungsten halogen calibration standard is stable to within (pm 0.5%) over 50 hours of cumulative operation. We recommend recalibration every 12 months or after every 100 hours of use—whichever occurs first. The sphere’s BaSO₄/PTFE coating should be repacked if the reflectance at 550 nm drops below 94%.
Q4: Is the system capable of measuring laser sources, such as phosphor-converted laser diodes?
Yes, but with a caveat. Laser sources with high spatial coherence can produce speckle within the sphere. The LPCE-3 includes a diffuser plate at the sphere entry port (removable) and a 2.5 ms integration dwell that averages speckle patterns. For CW lasers >1W, a neutral density filter is required to prevent detector saturation.
Q5: Which standard is used for determining the CRI of OLED panels with this system?
The system calculates CRI under CIE 13.3-1995, using the test source’s SPD to compute (T_{cr}) and the corresponding CCT. For OLED-specific testing, we recommend referencing the CIE 224:2017 standard for high-CRI sources (R1–R8 and R9–R15). The LPCE-3’s spectral resolution of 2.0 nm is sufficient to capture narrow-band emission peaks characteristic of phosphorescent OLED emitters.
 English
  Spanish
  Russian
  Portuguese
  Turkish
  Arabic
  German
  Polish
  Italian
  French
  Korean
  Japanese
  Indonesian