




The Necessity of Precision Photometric Measurement in Modern Illumination Systems
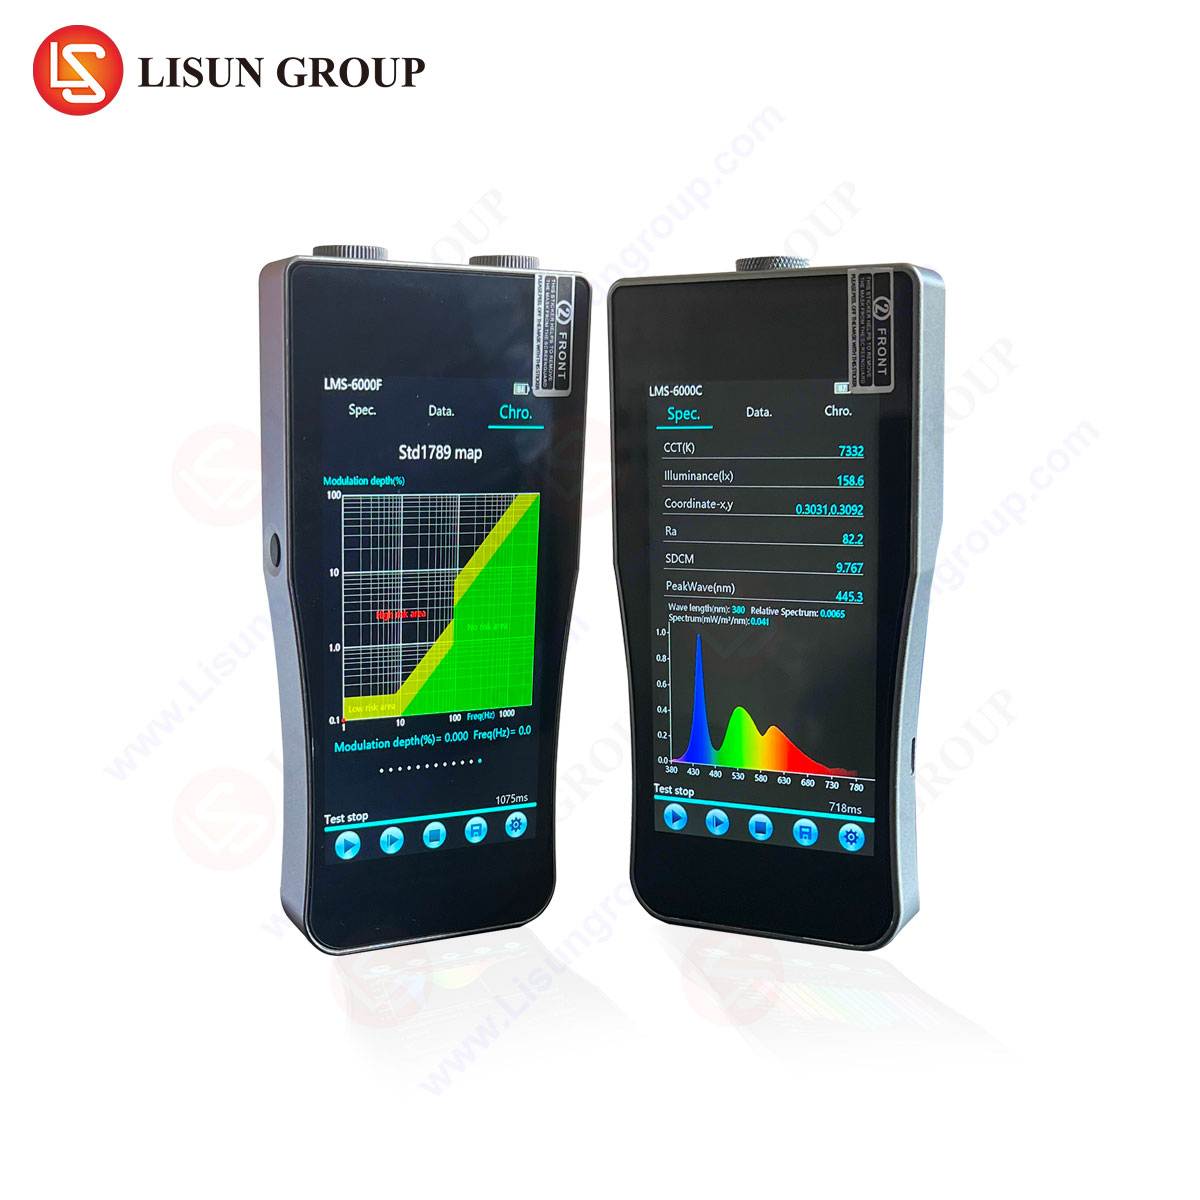
The shift from traditional lighting sources to solid-state lighting technologies has fundamentally altered the requirements for photometric measurement. LED and OLED sources exhibit spectral power distributions that differ markedly from incandescent or fluorescent sources, rendering conventional photometers inadequate for accurate intensity assessment. A professional LED light meter must compensate for these spectral variances through spectroradiometric principles rather than relying solely on filtered photodiode responses. The ЛИСУН LMS-6000 series спектрорадиометр, specifically the LMS-6000SF model, addresses this challenge by employing a Czerny-Turner optical configuration and a high-sensitivity array detector to resolve spectral data across the 380–780 nm visible range with 1 nm resolution. Accurate light intensity measurement requires consideration of cosine-corrected response, temperature stability of the detector, and calibration traceable to national standards. In industries ranging from automotive lighting testing to aerospace and aviation lighting, deviations exceeding 3% in correlated color temperature (CCT) or 5% in illuminance can result in non-compliance with regulatory frameworks such as CIE S 025 or IES LM-79-19. The following sections detail the methodology, instrumentation, and industry-specific applications for achieving reliable illumination testing outcomes.
Instrumentation Architecture and Spectroradiometric Operating Principles
The core of accurate light intensity measurement lies in the instrument’s ability to capture the full spectral signature of the source under test. The LISUN LMS-6000SF spectroradiometer integrates a diffraction grating monochromator coupled with a CCD array, enabling simultaneous acquisition of spectral data from 350 nm to 800 nm (extendable to 1100 nm for photovoltaic applications). This design eliminates errors introduced by scanning monochromators, such as temporal drift during measurement of pulsed LED sources. Key specifications include a wavelength accuracy of ±0.3 nm, a stray light rejection ratio of 10⁻⁵, and a dynamic range of 10⁶:1, which supports measurements from low-level luminance in medical lighting equipment (down to 0.001 cd/m²) to high-intensity stage lighting exceeding 100,000 lux. The instrument employs a cosine-corrected diffuser for illuminance measurements, adhering to the Lambertian response characteristics required by CIE 127. For luminous intensity measurements, a goniometric accessory can be integrated to capture angular distribution data critical in urban lighting design and marine and navigation lighting applications. The internal calibration is performed against a NIST-traceable standard halogen lamp, with recalibration intervals recommended at 12 months for laboratory environments and 6 months for field measurement scenarios.
Cosine Correction, Spectral Mismatch, and Their Influence on Measurement Fidelity
A primary source of error in LED light intensity measurement arises from spectral mismatch between the detector’s spectral responsivity and the CIE 1931 photopic luminosity function V(λ). Conventional lux meters using filtered photodiodes exhibit mismatch factors exceeding 15% for narrow-bandwidth LED sources (e.g., 450 nm blue LEDs or 660 nm red LEDs), leading to inaccuracies in illuminance values. Spectroradiometric instruments like the LMS-6000SF circumvent this limitation by directly measuring the spectral power distribution (SPD) and weighting it mathematically against V(λ). The cosine correction factor, defined as the ratio of actual illuminance to measured illuminance at incidence angles beyond 10°, must be maintained below 2% for field measurements. The LMS-6000SF achieves a cosine response within ±1.5% for angles up to 80°, validated through goniophotometric testing per CIE 69. For applications such as display equipment testing, where polar angle variations from 0° to 70° affect perceived luminance uniformity, the instrument’s cosine-corrected optical probe ensures that off-axis measurements remain within 2% of true values. Table 1 summarizes the impact of spectral mismatch and cosine error on measurement accuracy across common LED color types.
Table 1: Measurement Error Sources in Photometric Testing of LED Sources
| LED Type | Spectral Mismatch Error (Filtered Photodiode) | Spectral Mismatch Error (LMS-6000SF) | Cosine Error at 60° (Typical Meter) | Cosine Error at 60° (LMS-6000SF) |
|---|---|---|---|---|
| Cool White (6500K) | +12.3% | +0.4% | 8.7% | 1.2% |
| Warm White (3000K) | -6.8% | -0.2% | 8.7% | 1.2% |
| Blue (460 nm) | +21.5% | +0.6% | 8.7% | 1.2% |
| Red (630 nm) | -15.2% | -0.5% | 8.7% | 1.2% |
| Green (525 nm) | +9.1% | +0.3% | 8.7% | 1.2% |
Calibration Protocols and Traceability Chains for Industrial-Grade Measurements
Establishing a robust calibration protocol is essential for ensuring that light intensity measurements are both accurate and reproducible across different facilities and time periods. The calibration of the LISUN LMS-6000SF involves three primary stages: wavelength calibration using spectral line lamps (e.g., mercury-argon or krypton sources), photometric calibration using a standard illuminant A lamp (2856 K), and a temperature correction algorithm that compensates for detector dark current drift at ambient temperatures from 5°C to 40°C. For applications in LED & OLED manufacturing, where production lines require daily verification, a secondary calibration transfer can be performed using a stable reference LED (e.g., a 5000 K white LED with a CCT stability of ±20 K over 1000 hours). The uncertainty budget for the LMS-6000SF, calculated per the Guide to the Expression of Uncertainty in Measurement (GUM), yields a combined standard uncertainty of ±1.2% for illuminance, ±15 K for CCT above 4000 K, and ±1.5% for luminous flux when used with an integrating sphere. In scientific research laboratories, the traceability chain must extend to primary national standards; the instrument’s calibration certificate includes measurement uncertainty reported at a 95% confidence level (k=2). It is critical to note that calibration is invalid if the optical input port is contaminated or if the instrument has been subjected to mechanical shock exceeding 50 g.
Integrating Sphere Compatibility and Total Luminous Flux Determination
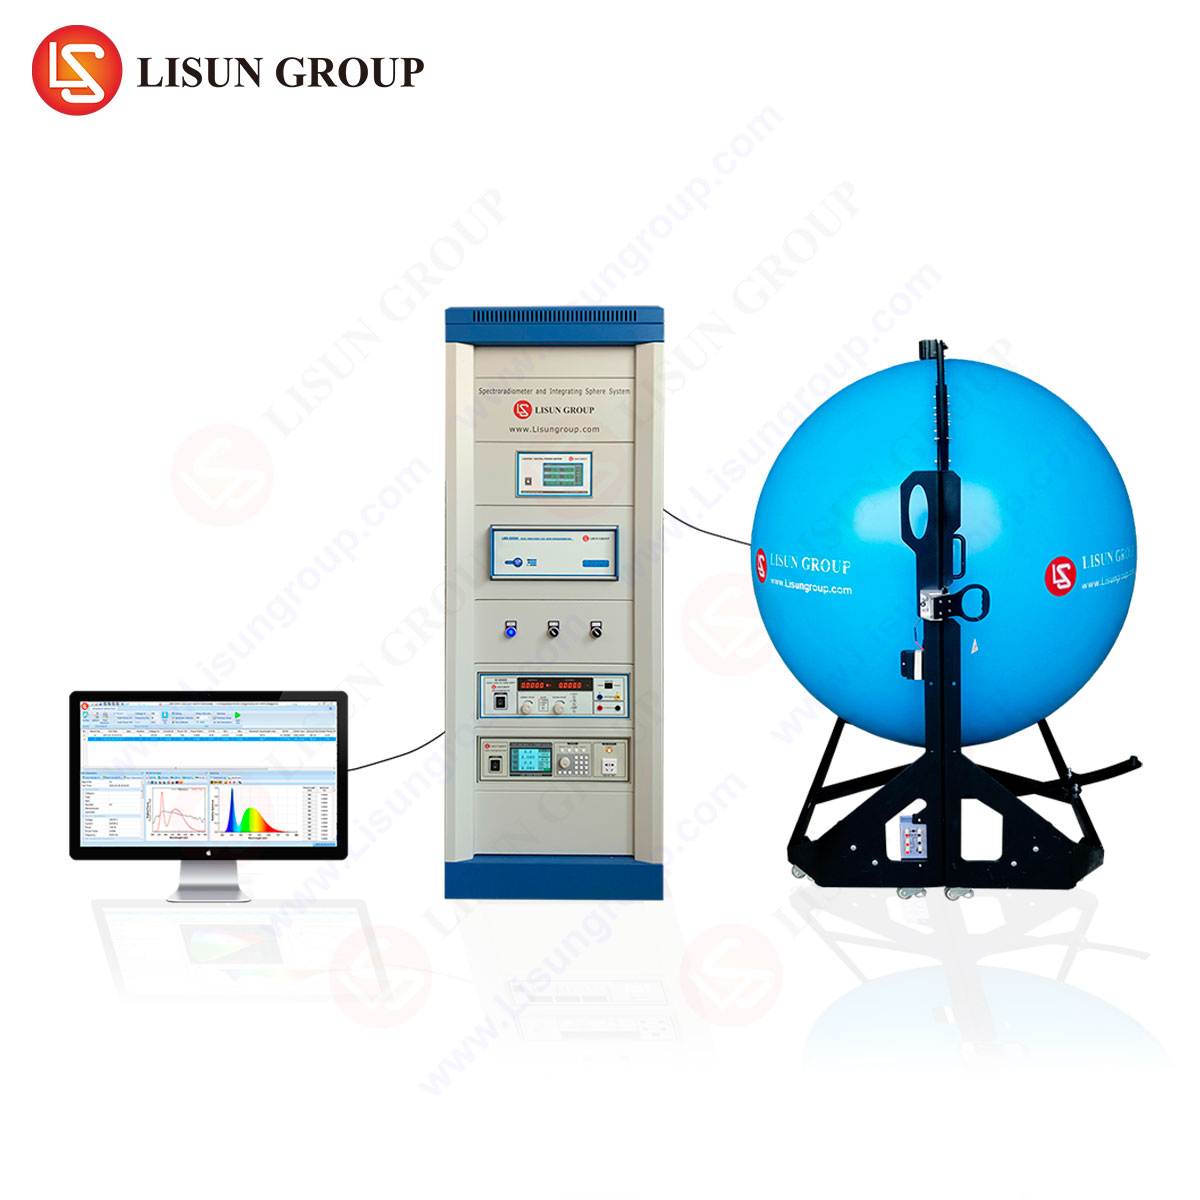
For total luminous flux measurements—essential in automotive lighting testing and stage and studio lighting—the spectroradiometer must be paired with an integrating sphere whose diameter is at least ten times the maximum dimension of the luminaire under test. The LMS-6000SF can be configured with a 2-meter sphere for testing large fixtures, or with a 300 mm sphere for discrete LEDs and small modules. The sphere’s interior coating (typically barium sulfate or Spectralon) must exhibit a reflectance of ≥94% across the 350–800 nm range, with spatial uniformity within 1%. Self-absorption correction is performed by measuring the SPD of a reference lamp with and without the test luminaire present, using the LMS-6000SF’s software to compute the correction factor automatically. For scenarios involving high-power LEDs that generate thermal emission in the infrared region (e.g., COB LEDs used in urban lighting design), the extended spectral range of the LMS-6000SF (up to 1100 nm) allows for accurate separation of visible and infrared flux components. The standard deviation of repeated luminous flux measurements under laboratory conditions (23°C ± 1°C, 50% RH) should not exceed 0.3% for a batch of 50 identical samples.
Luminance Measurement Techniques for Display and Surface Integration Testing
Display equipment testing, particularly for OLED panels and LCD backlights, requires measurement of luminance (cd/m²) at multiple points across the active area. The LISUN LMS-6000SF can be fitted with a luminance probe that incorporates a 1° or 2° acceptance angle, enabling spot measurements as small as 2 mm diameter at a distance of 500 mm. Uniformity testing per the VESA Flat Panel Display Measurements Standard (FPDM) involves measuring luminance at nine standard positions (center, four corners, four edges) and calculating the 9-point uniformity ratio. The instrument’s software supports automated scanning using a motorized XY stage, with data logging at intervals as short as 100 ms. For medical lighting equipment, such as surgical luminaires, luminance values exceeding 100,000 cd/m² can occur, requiring the LMS-6000SF’s neutral density filter option to attenuate incoming light by factors of 10×, 100×, or 1000× without affecting spectral distribution. The measurement uncertainty for luminance is maintained at ±2.0% for values between 0.1 cd/m² and 50,000 cd/m².
Spectral Quality Metrics and Compliance with International Standards
Accurate measurement of chromaticity coordinates, CCT, Duv (distance from the Planckian locus), and color rendering indices (CRI, TM-30 Rf and Rg) depends on high-resolution spectral data. The LMS-6000SF computes these metrics in real time using onboard processing, with CRI values reported for all 14 test color samples per CIE 13.3. In aerospace and aviation lighting, compliance with SAE AS8028 requires that white light sources for cockpit illumination have a CCT between 4500 K and 6500 K, with a Duv within ±0.003. The spectroradiometer achieves a CCT repeatability of ±5 K and a Duv resolution of 0.0001, enabling detection of batch-to-batch variations in LED phosphor composition. For photovoltaic industry applications, the spectral mismatch correction factor (MMF) between the solar simulator and the reference cell spectral response is calculated directly from the SPD, allowing I-V measurement correction per ASTM E948-16. Table 2 outlines the standards compliance matrix for the instrument across multiple industries.
Table 2: Standards Compliance for LISUN LMS-6000SF Spectroradiometer
| Application Area | Governing Standard | Measured Parameters | Compliance Requirement |
|---|---|---|---|
| Lighting Industry | IES LM-79-19 | Luminous flux, CCT, CRI | Uncertainty ≤ 2% for flux |
| Автомобильное освещение | SAE J578, ECE R112 | Chromaticity, intensity distribution | Duv ≤ ±0.006 |
| Display Testing | VESA FPDM 3.0 | Luminance uniformity, color gamut | 9-point uniformity ≥ 95% |
| Medical Equipment | IEC 60601-2-41 | Illuminance, color temperature | CCT ± 100 K |
| Photovoltaics | IEC 60904-9 | Spectral mismatch factor (MMF) | MMF within 1.0 ± 0.05 |
Field Measurement Adaptations and Environmental Considerations
Deploying a professional LED light meter in field environments introduces challenges such as ambient light interference, temperature variations, and physical positioning constraints. The LMS-6000SF is housed in a rugged chassis rated for IP54 ingress protection, with an operating temperature range of 0°C to 50°C. When used for urban lighting design surveys or marine and navigation lighting inspections, the spectroradiometer’s optical fiber input allows the probe to be positioned at distances up to 10 meters from the main unit, reducing the influence of operator body heat and reflected radiation. For measurements in stage and studio lighting environments, where high-frequency PWM dimming can cause temporal aliasing, the integration time can be set to a multiple of the LED driver’s pulse cycle (e.g., 200 ms for a 100 Hz flicker frequency), ensuring that the measured SPD reflects the time-averaged output. A built-in tilt sensor and digital level compensate for deviations from normal incidence when measuring horizontal illuminance. The instrument’s internal memory can store up to 10,000 measurement records, with battery life of 8 hours under continuous operation or 24 hours in intermittent logging mode.
Wavelength Calibration Verification and Routine Maintenance Procedures
The integrity of light intensity measurements degrades over time unless routine verification procedures are implemented. The LMS-6000SF includes an automatic wavelength calibration function using an internal low-pressure mercury lamp that emits a known spectral line at 546.07 nm. This calibration should be performed prior to each measurement session if the ambient temperature has changed by more than 5°C from the previous calibration. For optical instrument R&D environments where measurement of narrow-band sources (e.g., laser diodes or quantum dot emitters) is common, the full-width at half-maximum (FWHM) of the instrument’s slit function must be maintained within 2.0 nm. Cleaning of the optical fiber end face and the integrating sphere’s entrance port is performed using lens-grade isopropyl alcohol and lint-free wipes, with a frequency of once per month for laboratory use and weekly for field use. Dark current subtraction is executed automatically at the start of each measurement, with a reference dark frame captured at the same integration time and temperature as the measurement frame. If the dark current exceeds 0.5% of the signal level at the peak wavelength, the instrument should be recalibrated.
Data Analysis Software and Reporting Capabilities for Compliance Documentation
The LISUN software suite bundled with the LMS-6000SF provides comprehensive data analysis features, including automatic generation of PDF test reports that include spectral curves, numerical tables, and pass/fail indicators based on user-defined limits. For scientific research laboratories, the raw spectral data can be exported in ASCII or CSV format for further processing in MATLAB or Python. The software supports multiple measurement modes: single shot, time averaging (up to 256 cycles), and continuous monitoring for tracking intensity drift over periods up to 72 hours. In display equipment testing, the software can overlay color gamut plots against standard color spaces (sRGB, Adobe RGB, DCI-P3, Rec. 2020) with delta E*ab calculations for 24 color patches. The reporting module complies with the data format requirements of the Lighting Industry’s NEMA 4.0 standard, facilitating submission of testing results to regulatory bodies. Each report includes a measurement uncertainty statement, calibration traceability information, and a timestamp synchronized to NIST via NTP if connected to a network.
Frequently Asked Questions
1. How often should the LISUN LMS-6000SF be recalibrated to maintain accuracy for LED manufacturing quality control?
Recalibration is recommended every 12 months under standard laboratory conditions (temperature 23°C ± 2°C, humidity 30–60%). For high-usage environments in LED manufacturing where the instrument is used daily for more than 100 measurements, a 6-month calibration interval is advisable. The manufacturer provides a recalibration service with a turnaround time of 5 business days, including a full performance verification report.
2. Can the LMS-6000SF measure light intensity of pulsed LED sources used in automotive lighting without data aliasing?
Yes. The instrument’s integration time can be set to synchronize with PWM frequencies from 50 Hz to 20 kHz. For frequencies above 1 kHz, a fast readout mode with 100 μs minimum integration time is available. For very short pulses (e.g., 10 μs), the optional high-speed photodiode module can be used in conjunction with the spectroradiometer to capture temporal intensity profiles.
3. What is the difference between the LMS-6000SF and standard lux meters when measuring color temperature of cool white LEDs?
Standard lux meters provide only a coarse estimate of correlated color temperature, often with errors exceeding 200 K for cool white LEDs (6000–7000 K) due to spectral mismatch. The LMS-6000SF measures the full spectral power distribution and calculates CCT using the CIE 1931 2° standard observer, achieving an accuracy of ±15 K under reference conditions. This difference (200 K vs. 15 K) is critical for applications such as medical lighting or display calibration.
4. Is the instrument suitable for outdoor measurements of street lighting or architectural floodlighting in varying weather conditions?
Yes, the LMS-6000SF is rated IP54, making it resistant to dust and water splashes. For outdoor measurements, the optical probe should be shielded from direct sunlight using a shade ring to avoid saturation of the detector. The instrument’s temperature compensation algorithm maintains measurement accuracy within ±1% over an ambient temperature range of 0°C to 40°C. Additionally, the software can apply a rain-droplet correction factor if the probe’s diffuser becomes partially wetted.
5. How does the instrument handle the measurement of ultra-violet (UV) components in medical lighting equipment?
The LMS-6000SF can be ordered with an extended UV option (LMS-6000UV) that covers 280–780 nm, specifically designed for measuring UV-A and UV-B output from phototherapy lamps. The instrument includes a UV-wavelength calibration using a deuterium lamp standard, and the software reports UV hazard indices per IEC 62471 (photobiological safety). The stray light rejection at 300 nm is better than 10⁻⁴, ensuring accurate measurement of low-level UV emissions in the presence of strong visible light.
 English
  Spanish
  Russian
  Portuguese
  Turkish
  Arabic
  German
  Polish
  Italian
  French
  Korean
  Japanese
  Indonesian