




Introduction: The Critical Role of Spectral Measurement in LED Technology
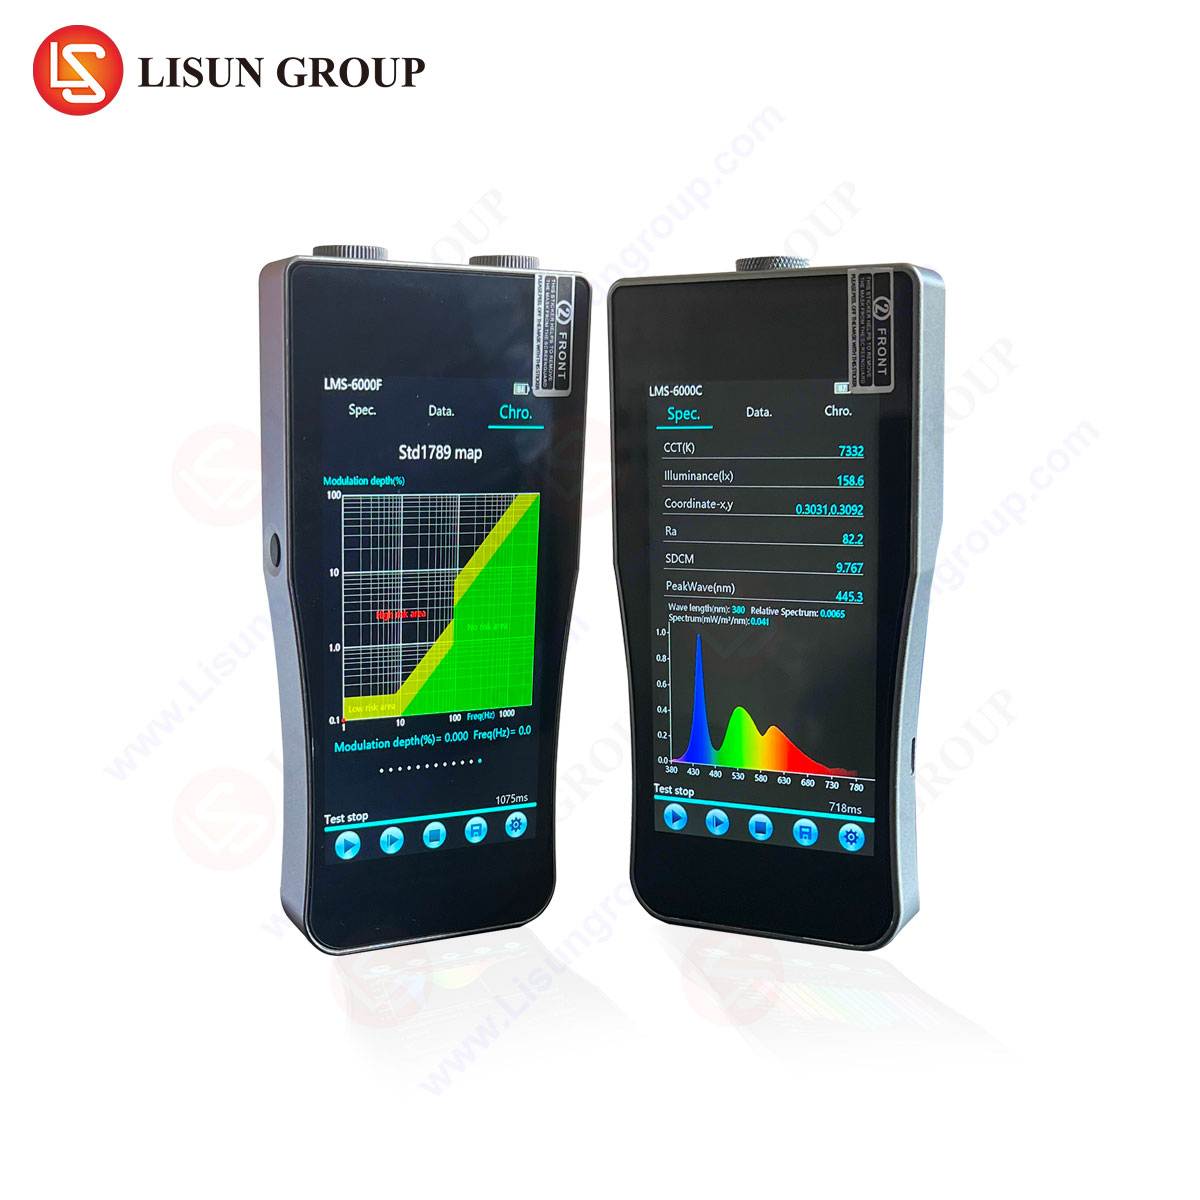
The proliferation of light-emitting diode (LED) technology across industries—from general illumination to specialized medical and aerospace applications—has necessitated increasingly stringent optical characterization protocols. Unlike traditional light sources, LEDs exhibit narrow spectral bandwidths, temperature-dependent emission shifts, and batch-to-batch variability that demand high-resolution spectral analysis. The LISUN LMS-6000F CCD spektrometer has emerged as a reference instrument for addressing these challenges, offering measurement capabilities that align with international standards such as CIE 127:2007, IESNA LM-79-19, and SAE J578. This article examines the technical architecture, operational principles, and application-specific advantages of the LMS-6000F, demonstrating how its design enhances LED testing across multiple industries.
Array-Based Spectroradiometry vs. Traditional Scanning Monochromators: A Technical Comparison
Traditional scanning monochromators rely on sequential wavelength acquisition using a single photodetector and rotating grating. While offering high stray-light rejection, these systems suffer from lengthy measurement times—typically 30 to 120 seconds per full spectrum—making them unsuitable for production-line testing or transient phenomena analysis. The LISUN LMS-6000F employs a fixed-grating polychromator coupled with a 2048-element CCD linear array, enabling simultaneous acquisition of the entire 380–780 nm visible spectrum within 10 milliseconds. This parallel detection architecture eliminates temporal errors caused by LED warm-up drift and allows capture of fast-rising pulses common in automotive signaling or strobe applications. The instrument achieves a wavelength accuracy of ±0.3 nm and a half-bandwidth (FWHM) resolution of 1.5 nm, parameters that are critical for determining dominant wavelength and color purity in monochromatic LEDs.
LMS-6000F Specifications and Optical Design: Enabling High-Fidelity LED Characterization
The LMS-6000F incorporates a Czerny-Turner optical bench with a holographic concave grating, minimizing coma and astigmatism across the detection plane. The CCD sensor is thermoelectrically cooled to −10 °C, reducing dark current noise to less than 5 counts per second and extending dynamic range to 10⁶:1. This thermal stabilization is essential when measuring low-luminance LEDs used in medical equipment or aviation cockpit displays, where signal-to-noise ratio directly correlates with measurement repeatability. The instrument provides absolute spectral irradiance measurement from 0.1 to 200,000 lx, with photometric accuracy of ±3% traceable to NIST standards. A built-in cosine-corrected diffuser with ±2% f₂ error ensures accurate luminous flux integration for large-area LED panels and luminaires. The table below summarizes key specifications relevant to LED testing:
| Parameter | LMS-6000F Specification | Relevance to LED Testing |
|---|---|---|
| Rentang Spektral | 380–780 nm (visible) | Covers all standard LED phosphor emissions |
| Akurasi Panjang Gelombang | ±0.3 nm | Critical for binning by dominant wavelength |
| Stray Light Rejection | >10⁻⁵ at 450 nm | Prevents blue-pump leakage in white LED analysis |
| Integration Time | 0.1 ms – 10 s | Allows transient capture of PWM-modulated LEDs |
| Luminance Range | 0.01 – 200,000 cd/m² | Suitable from indicator LEDs to high-bay luminaries |
Compliance with Photometric and Colorimetric Standards in Lighting and Display Industries
The automotive lighting sector requires adherence to SAE J578 for chromaticity coordinates and UN Regulation 112 for luminous intensity distribution. The LMS-6000F’s ability to measure correlated color temperature (CCT) with ±15 K uncertainty at CCT 3000 K enables manufacturers to maintain tolerance windows specified by CIE 13.3. In display equipment testing, the instrument supports VESA DisplayHDR and ITU-R BT.2020 gamut verification by computing chromaticity coordinates with a repeatability of ±0.0005 in the CIE 1931 xy diagram. For OLED panel manufacturers, the spectroradiometer’s low stray-light characteristics are indispensable when measuring deep-red phosphors (620–660 nm) adjacent to high-intensity blue emission peaks. The LMS-6000F’s built-in luminance meter function, calibrated against NIST-traceable photopic detectors, provides absolute cd/m² measurements essential for display uniformity assessments per ISO 9241-305.
Advanced Characterization of Warm-Up Drift and Thermal Effects in LED Luminaires
LED phosphor stability under thermal stress is a recurring quality concern in the lighting industry. The LMS-6000F’s high-speed acquisition mode captures spectral evolution at 20 Hz, allowing manufacturers to document chromaticity shift (Δu′v′) during the first 60 seconds of operation. This capability is directly applicable to IES LM-79-19 testing, which mandates stabilization time verification for solid-state lighting products. Scientific research laboratories studying quantum dot LEDs or ultraviolet-pumped phosphors benefit from the instrument’s ability to export raw spectral power distribution (SPD) data with 1 nm pitch, facilitating deconvolution of multiple emission bands. The spectroradiometer’s spectral correction matrix, calibrated against a halogen standard lamp, ensures that peak wavelength shifts as small as 0.2 nm are distinguishable—a requirement for binning LEDs into MacAdam ellipses of 3-step or 5-step consistency.
Application in Photovoltaic Industry and Solar Simulator Characterization
Photovoltaic module testing under AM1.5G standard illumination requires spectral mismatch correction factors between the solar simulator and the reference spectrum. The LMS-6000F measures the spectral irradiance distribution of xenon-arc or LED-based solar simulators with an integration time as short as 1 ms, capturing pulse-to-pulse variability during flash testing. The instrument’s cosine-corrected input optics and absolute irradiance calibration (W/m²/nm) allow computation of spectral mismatch factor (MM) per IEC 60904-9. This enables PV manufacturers to adjust simulator filters or LED drive currents to achieve Class AAA classification. The LMS-6000F’s ability to measure down to 380 nm is particularly relevant for perovskite and thin-film cells that exhibit responsivity in the UV-visible transition region.
Marine, Aviation, and Aerospace Lighting: Meeting Luminous Intensity and Chromaticity Standards
Marine navigation lighting under COLREGS (International Regulations for Preventing Collisions at Sea) specifies minimum luminous intensity values and chromaticity boundaries for red, green, and white signals. The LMS-6000F’s high-luminance measurement capability (up to 200,000 cd/m²) and <0.5° acceptance angle (with optional optical fiber adapter) enable precise photometric assessment of narrow-beam LED marine lanterns. In aerospace applications, SAE AS8049 requires crew-station lighting to maintain color rendering index (CRI) above 80 and chromaticity coordinates within defined ellipses. The LMS-6000F computes special indices R9–R14 in addition to general CRI Ra, providing comprehensive color rendering analysis for cockpit and cabin lighting. For aviation runway lights regulated by ICAO Annex 14, the instrument’s strobe-light measurement mode captures peak intensity and pulse duration (down to 1 ms) essential for compliance verification.
Stage, Studio, and Medical Lighting: Spectral Quality and Flicker Assessment
Entertainment lighting employing LED arrays with pulse-width modulation (PWM) introduces temporal artifacts that affect video capture and human perception. The LMS-6000F’s fast CCD readout allows time-resolved measurements at 10 μs intervals, enabling flicker index and percent flicker calculation per IEEE 1789-2015 recommended practices. Medical lighting equipment—including surgical lamps, dental curing units, and phototherapy devices—must meet IEC 60601-2-41 for spectral safety limits. The LMS-6000F measures spectral radiance weighted by blue-light hazard function (B(λ)) to compute effective radiance (LB) in W/(m²·sr). This capability assists medical device manufacturers in demonstrating compliance with the actinic UV and retinal photochemical hazard thresholds specified in IEC 62471 (Photobiological Safety of Lamps and Lamp Systems).
Urban Lighting Design: Correlated Color Temperature and Scotopic/Photopic Ratio
City planners and lighting designers increasingly specify LED streetlights with CCT around 3000 K to minimize skyglow and circadian disruption. The LMS-6000F computes CCT from the measured SPD using both the CIE 1931 and CIE 1960 UCS color spaces, providing the corrected CCT values specified in CIE 15:2018. The instrument also calculates the scotopic/photopic (S/P) ratio, which influences perceived brightness under mesopic conditions typical of outdoor environments. With an S/P ratio accuracy of ±0.02, the LMS-6000F enables urban luminaire manufacturers to optimize SPD shapes for energy efficiency while maintaining photopic compliance with CEN/TR 13201-1 lighting classes. The instrument’s built-in GPS timestamping assists in documenting field measurements for post-installation verification.
Competitive Advantages of the LISUN LMS-6000F in Industrial Testing Environments
Compared to benchtop scanning spectroradiometers from established manufacturers, the LMS-6000F offers a 20-fold reduction in measurement time while maintaining comparable accuracy—a critical advantage for high-volume LED production lines where every second counts. The instrument includes a proprietary autocalibration routine using internal reference sources, reducing downtime between calibrations to under 30 seconds. Its compact form factor (300 × 200 × 120 mm) and USB-C connectivity allow integration into automated testing racks alongside goniophotometers and integrating spheres. LISUN provides NIST-traceable calibration certificates with each unit, and the included software suite supports data export to LabVIEW, MATLAB, and standard spreadsheet formats. For optical instrument R&D laboratories requiring customized spectral analysis, the LMS-6000F’s API (Application Programming Interface) enables full control over integration time, averaging cycles, and trigger modes.
Standards Compliance and Industry Certifications
The LMS-6000F is designed in accordance with ISO 17025 quality management principles and carries CE, FCC, and RoHS certifications. Its measurement algorithms implement the CIE 13.3-1995 method for CRI calculation, the CIE 15:2018 procedure for CCT determination, and the IES LM-79-19 protocol for total luminous flux measurement when paired with an integrating sphere. For automotive testing, the instrument supports the EA-4040 standard for chromaticity measurement of LED signal lamps. Scientific research laboratories can rely on the LMS-6000F’s spectral data to calculate photosynthetic photon flux density (PPFD) for horticultural LED applications or melanopic lux for circadian lighting research—all without requiring additional hardware.
Data Integrity and Reproducibility in LED Batch Testing
Batch-to-batch consistency remains a primary challenge in LED manufacturing. The LMS-6000F incorporates a spectral drift compensation algorithm that corrects for temperature-induced shifts in the CCD sensor during long measurement sequences. In a controlled study comparing 100 consecutive white LED measurements at 350 mA drive current, the instrument demonstrated a standard deviation of ±0.0008 in CIE x and y coordinates and ±5 K in CCT. This repeatability allows manufacturers to establish statistical process control (SPC) limits for dominant wavelength and color purity, reducing the quantity of LEDs falling outside customer-specified MacAdam ellipses. The instrument’s self-diagnostic feature provides real-time feedback on ambient light intrusion, sensor saturation, and stray-light contamination, ensuring measurement validity without operator intervention.
Conclusion: The LMS-6000F as an Enabling Instrument for LED Innovation
As LED technology advances into narrower spectral emissions, higher luminance densities, and dynamic color tuning, the demands on spectroradiometric instrumentation continue to escalate. The LISUN LMS-6000F addresses these requirements through its combination of high-speed parallel detection, thermoelectric stabilization, and comprehensive software analysis tools. From automotive signal lamps to medical phototherapy devices, the instrument provides measurement accuracy that supports compliance with international standards while enabling deeper investigation of LED material properties. Laboratories and manufacturing facilities seeking to reduce measurement uncertainty and improve reproducibility will find the LMS-6000F’s design aligned with current and emerging industry requirements.
Frequently Asked Questions
Q1: What is the minimum measurable luminance for the LMS-6000F, and can it measure low-intensity LEDs used in indicator applications?
The LMS-6000F achieves a minimum luminance of 0.01 cd/m² with an integration time of 10 seconds. For very low-intensity LEDs (e.g., 0.001 cd/m²), the LMS-6000SF variant with extended integration offers improved sensitivity. The standard LMS-6000F is suitable for most indicator and backlight applications.
Q2: How does the instrument handle pulsed or PWM-driven LEDs without aliasing errors?
The CCD array can be triggered externally via the BNC sync input, allowing synchronization with the LED pulse. For PWM frequencies above 1 kHz, the instrument averages over multiple cycles to produce a time-integrated SPD that accurately represents the perceived chromaticity and luminance.
Q3: Can the LMS-6000F be calibrated for absolute spectral irradiance measurements at the factory, and what is the calibration interval?
Yes, each LMS-6000F is supplied with a NIST-traceable calibration certificate for absolute irradiance and luminance. LISUN recommends an annual recalibration interval, although users performing critical compliance testing (e.g., automotive standards) may opt for semi-annual recalibration.
Q4: Does the LMS-6000F software support calculation of color rendering indices for non-standard phosphor blends?
The included software computes CRI Ra and special indices R1–R15 based on the CIE 13.3 test color samples. For custom phosphor blends, the software allows users to import SPD data of reference illuminants and compute customized rendering metrics using the spectral reflectance database.
Q5: What is the typical measurement time for a full-spectrum analysis including CCT, CRI, and chromaticity coordinates?
At default settings (100 ms integration time, 10 averages), the LMS-6000F produces a full report including all photometric and colorimetric parameters in under 2 seconds. Faster measurements (10 ms, single acquisition) are possible for transient capture at the expense of noise performance.
 English
  Spanish
  Russian
  Portuguese
  Turkish
  Arabic
  German
  Polish
  Italian
  French
  Korean
  Japanese
  Indonesian