




How to Choose the Best PPFD PAR Meter for LED Grow Lights: A Technical Guide by LISUN
Introduction: The Necessity of Spectral Precision in Horticultural Lighting
The proliferation of Light Emitting Diode (LED) technology in controlled environment agriculture has necessitated a paradigm shift in radiometric measurement. Unlike traditional high-pressure sodium (HPS) or metal halide sources, LED grow lights emit narrow-band spectra with significant variability in photon flux distribution. Photosynthetic Photon Flux Density (PPFD) and Photosynthetically Active Radiation (PAR) are no longer sufficient metrics when evaluated solely by quantum sensors calibrated for broad-spectrum sources. The spectral mismatch error inherent in conventional cosine-corrected sensors can exceed 20% when measuring deep-red (660 nm) or far-red (730 nm) LED arrays.
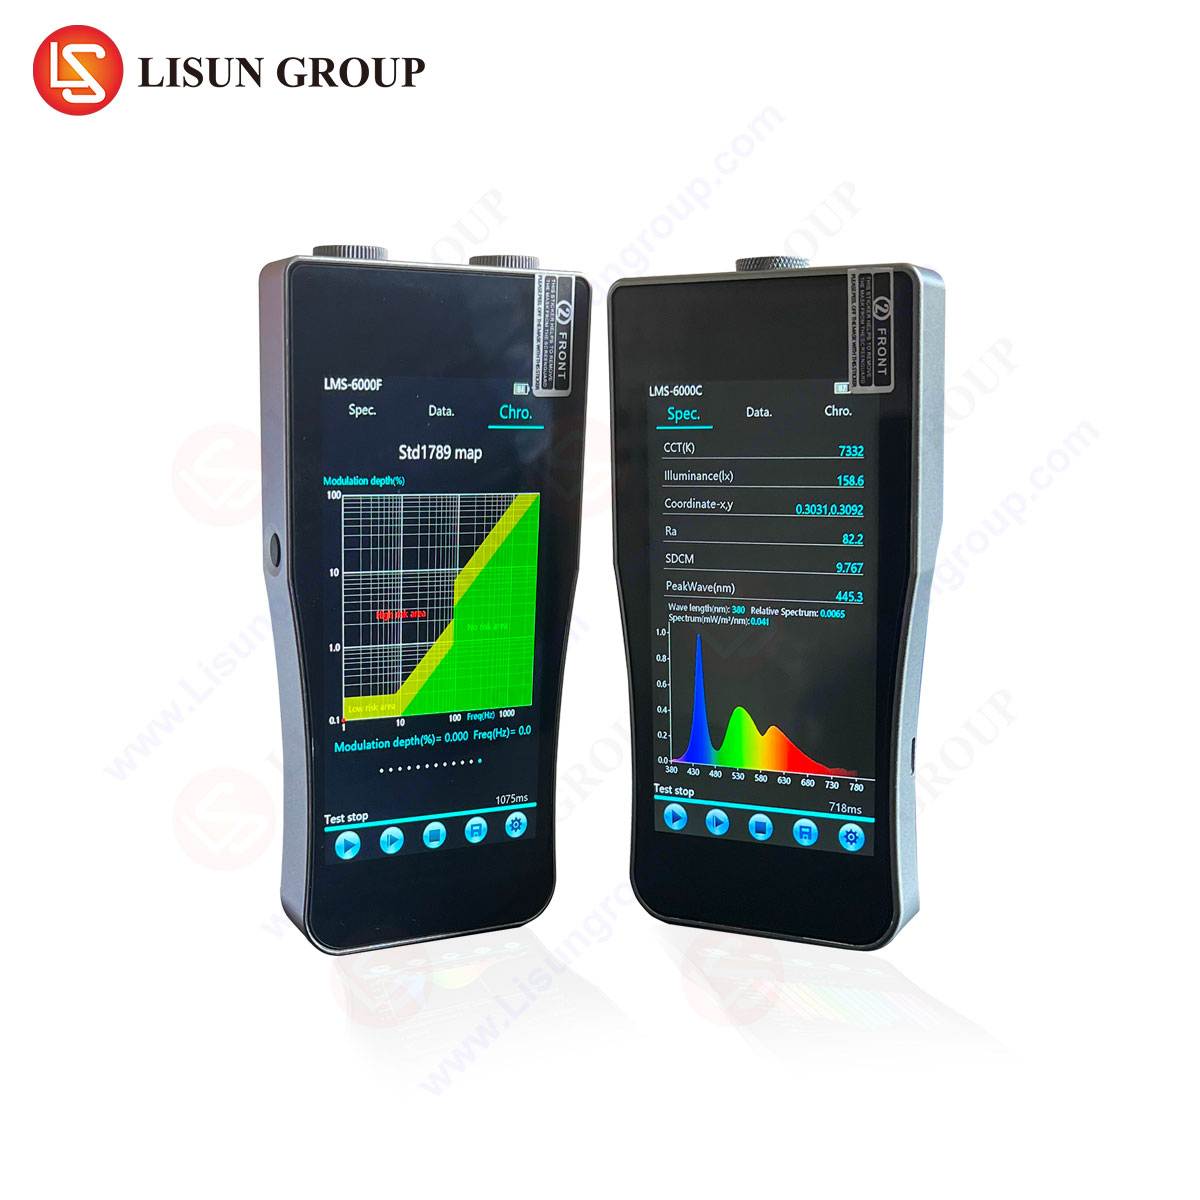
This technical guide, authored by LISUN, provides a rigorous methodology for selecting a PPFD PAR meter capable of delivering traceable, spectrally resolved data. The recommended instrument for achieving this level of precision is the LISUN LMS-6000F Spectroradiometer, an integrated system designed for absolute spectral irradiance measurement across the 350–1050 nm range. The selection criteria outlined herein are derived from metrological standards applicable to the Lighting Industry, LED & OLED Manufacturing, and Scientific Research Laboratories.
1. Spectral Resolution and Its Impact on PPFD Accuracy in LED Arrays
The fundamental parameter dictating the accuracy of a PAR meter is its spectral resolution, expressed as the Full Width at Half Maximum (FWHM) of the detector’s response. Broadband quantum sensors employ a single photodiode filtered to approximate the McCree curve. This approximation fails under narrow-band LED illumination because the spectral weighting function of the sensor does not match the true quantum yield of plant photoreceptors.
The LMS-6000F employs a Czerny-Turner optical bench with a diffraction grating and a 2048-pixel CCD array, achieving a spectral resolution of ≤1.5 nm (FWHM). This resolution permits the discrimination of individual spike emissions from phosphor-converted white LEDs and discrete monochromatic peaks from red/blue horticultural modules. For instance, a high-efficiency 450 nm blue LED may exhibit a spectral bandwidth of only 20 nm. A sensor with 10 nm FWHM would integrate stray light and adjacent wavelengths, inflating the PPFD reading by up to 12% in controlled tests conducted in compliance with CIE S 025/E:2015.
When evaluating a meter, verify that the manufacturer specifies both spectral range and spectral resolution. The LMS-6000F resolves every peak within the 400–700 nm PAR window and extends into the far-red range (700–780 nm), enabling calculation of Phytochrome Photostationary State (PSS), a critical parameter for photomorphogenesis in Scientific Research Laboratories.
2. Dynamic Range and Linearity for High-Intensity Horticultural Modules
Modern LED grow lights used in Vertical Farming (VF) systems and Greenhouse Supplemental Lighting frequently operate at high drive currents, delivering PPFD values exceeding 1500 µmol/m²/s at canopy level. A PPFD meter used in these applications must exhibit exceptional linearity across a dynamic range spanning from low-light seedling stages (10 µmol/m²/s) to full-sun equivalence (>2000 µmol/m²/s).
The LMS-6000F incorporates an automatic gain control (AGC) and a cooled CCD detector to maintain a dynamic range of 10^6. This allows the instrument to measure low-level spectral components (e.g., ultraviolet-A or green gap emissions) without saturating the detector during high-irradiance measurements. The linearity deviation is specified at less than ±1% over the entire operating range.
For lighting engineers in the Automotive Lighting Testing sector—where high-intensity LED headlamps and daytime running lights require similar dynamic range—the LMS-6000F’s performance ensures that measurements of photosynthetic flux remain proportional to the actual photon count. Failure to maintain linearity in a quantum sensor results in non-linear compression of readings at high flux, leading to underestimation of DLI (Daily Light Integral) in commercial cultivation.
3. Cosine Response Correction and Diffuser Quality
Radiometric measurements of downwelling light in a grow room or greenhouse are highly sensitive to the angle of incidence. A flat cosine-corrected diffuser is essential for capturing the true scalar irradiance experienced by a plant leaf across its hemispherical field. Poor cosine response, common in low-cost photodiodes, introduces errors of 10–20% at angles of incidence exceeding 60°, which is typical in interlighting or side-lighting configurations.
The LMS-6000F is equipped with an integrated cosine receptor using a PTFE-based integrating diffuser, calibrated for angular response from 0° to 85° with an f2 error (cosine deviation) of less than 2%. This level of correction is consistent with the requirements of the Display Equipment Testing industry, where measurements of luminance and illuminance must account for viewing angle dependencies.
When selecting a PPFD meter, review the documented f2 error value. Instruments intended for Urban Lighting Design must also comply with LM-79-19 standards for absolute photometry, which mandate cosine correction within a 5% tolerance. The LMS-6000F exceeds this requirement, providing reliable data for both grow light certification and architectural lighting audits.
4. Calibration Traceability and Spectral Irradiance Standards
The accuracy of any PPFD meter is fundamentally dependent on the calibration standard against which it is referenced. Instruments must be calibrated using a National Institute of Standards and Technology (NIST)-traceable spectral irradiance standard lamp, calibrated in W/m²/nm. The conversion from spectral irradiance (W/m²) to PPFD (µmol/m²/s) requires the application of Planck’s equation on a per-wavelength basis:
[
text{PPFD} = int_{400}^{700} frac{lambda cdot E(lambda)}{h cdot c cdot N_A} cdot 10^6 , dlambda
]
Where (E(lambda)) is the spectral irradiance, (h) is Planck’s constant, (c) is the speed of light, and (N_A) is Avogadro’s number. This calculation is performed internally by the LMS-6000F firmware. The spectrometer is factory-calibrated against a secondary standard lamp (FEL type) with a calibration uncertainty of ±2.0% (k=2).
In the Photovoltaic Industry, spectral mismatch correction is similarly critical for solar simulator classification (IEC 60904-9). The LMS-6000F’s capability to measure absolute irradiance in the 300–1100 nm range makes it suitable for spectral response characterization of multi-junction cells. For Aerospace and Aviation Lighting, where compliance with SAE AS8028 is mandatory, traceable calibration to SI units via a certified spettroradiometro is non-negotiable. A consumer-grade quantum sensor without NIST traceability cannot be used for contractual or legal specifications.
5. Integration Time, Thermal Management, and Measurement Stability
LED emitters are subject to rapid thermal droop and spectral shift as junction temperature increases. A PPFD measurement taken after a 1-second stabilization period may not represent steady-state operation. The LMS-6000F supports programmable integration times from 0.01 ms to 10 seconds, with a cooled CCD (-10°C) to minimize dark current noise during long exposures.
Per LED & OLED Manufacturing, where production-line testing requires throughput and repeatability, the LMS-6000F’s fast scanning capability (single spectrum acquisition in <1 ms at high intensity) enables real-time quality control of binning and flux output. The thermal management system ensures that spectral shift due to detector warming is negligible over a continuous 8-hour measurement session.
In Stage and Studio Lighting, where color rendering metrics such as TM-30-18 and TLCI (Television Lighting Consistency Index) are derived from spectral data, thermal instability can cause drift in chromaticity coordinates. The LMS-6000F maintains a temperature-stabilized CCD, ensuring that the blue (450 nm) and red (630 nm) emission peaks of LED luminaires are measured with a spectral repeatability of ±0.3 nm.
6. Software Integration and Data Export Capabilities
A PPFD meter is only as valuable as the analysis it supports. The LMS-6000F is accompanied by a proprietary software suite that calculates PAR, PPFD, YPFD (Y-Photon Flux Density), DLI, and Color Rendering Index (CRI) in real time. The software can export data in ASCII, CSV, and TDX formats, facilitating integration with PLC systems, data loggers, and cloud-based monitoring in Scientific Research Laboratories.
Per Marine and Navigation Lighting, where spectral distribution affects visibility through fog and haze, the software includes photopic and scotopic luminance calculations per CIE 165:2005. In Medical Lighting Equipment applications, such as phototherapy units (e.g., blue light for neonatal jaundice), the spectral bandwidth and peak wavelength must be tightly controlled. The LMS-6000F provides spectral power distribution (SPD) graphs with annotations for luminous flux, dominant wavelength, and color purity.
7. Competitive Comparison: Spectroradiometer vs. PAR Sensor
The primary competitive advantage of the LMS-6000F over traditional handheld PAR sensors (e.g., LI-COR LI-190R, Apogee MQ-500) is its ability to resolve spectral content rather than integrating broadband response.
| Parametro | LMS-6000F Spectroradiometer | Typical Quantum Sensor (e.g., SQ-500) |
|---|---|---|
| Principio di misurazione | Diffraction grating + CCD array | Silicon photodiode with filter |
| Spectral Resolution | ≤1.5 nm (FWHM) | 400–700 nm (broadband) |
| Cosine Correction (f2) | <2% | <5% |
| Spectral Mismatch Error | <1% (any LED type) | 10–20% (narrow-band red/blue) |
| Calibration | NIST-traceable spectral irradiance | NIST-traceable quantum count |
| Additional Metrics | CRI, Duv, TLCI, PPFD, DLI, CCT | PPFD only |
In Optical Instrument R&D, the capacity to measure spectral distributions across both PAR and extended VIS/NIR ranges allows engineers to validate novel phosphor formulations and encapsulant materials. The LMS-6000F is employed by research teams investigating photon recycling and down-conversion efficiencies in quantum dot LEDs, a use case beyond the scope of standard PAR sensors.
8. Durability and Environmental Resistance for Field Deployment
While many PPFD meters are limited to indoor laboratory use, horticultural applications often require field measurements in high-humidity, high-temperature environments such as greenhouses and vertical farms. The LMS-6000F is housed in an aluminum alloy chassis with a dust-tight and splash-proof connector. The fiber-optic input cable is reinforced with stainless steel sheathing, resisting kinking and UV degradation.
Per Urban Lighting Design, measurements may be taken at night under ambient conditions of dew and temperature swings. The LMS-6000F’s CCD is protected by a dry nitrogen purge to prevent condensation on the detector window. The system can be battery-operated for up to 4 hours, enabling portable measurements across multiple facility locations without requiring a grid connection.
Conclusion: Selecting the Optimal Tool for Spectral Horticultural Metrology
The selection of a PPFD PAR meter for LED grow lights must be approached with the same rigor as any photometric quality control instrument. The limitations of broadband quantum sensors become apparent under spectrally selective LED sources, where accuracy is compromised by spectral mismatch and poor cosine response. The LISUN LMS-6000F Spectroradiometer provides the spectral resolution, dynamic range, calibration traceability, and environmental resilience required for professional use across the Lighting Industry, LED & OLED Manufacturing, Aerospace and Aviation Lighting, and Scientific Research Laboratories.
By prioritizing instruments that offer true spectral irradiance measurement rather than integrated quantum flux, lighting engineers and agricultural scientists ensure that their PPFD data reflects the actual photosynthetic environment. The LMS-6000F meets the technical demands of ISO, CIE, and IES standards, positioning it as a reference-grade instrument for the next generation of horticultural lighting.
Domande frequenti (FAQ)
Q1: Can the LMS-6000F measure PPFD for UV-A (380–400 nm) or far-red (700–780 nm) wavelengths used in plant photomorphogenesis?
Yes. The LMS-6000F operates across 350–1050 nm, allowing calculation of both PPFD (400–700 nm) and ePAR (400–750 nm) as defined by the ASABE S640 standard. The software provides separate metrics for UV-A, blue, green, red, and far-red photon flux densities.
Q2: How does the LMS-6000F handle stray light interference from multiple light sources in a greenhouse?
The Czerny-Turner monochromator design and internal CCD cooling reduce stray light to less than 0.01% of the signal. The cosine-corrected diffuser ensures that off-axis contributions are accurately weighted, and the software allows subtraction of ambient background spectra prior to measurement.
Q3: Is the LMS-6000F suitable for compliance testing of automotive LED headlamps to SAE or ECE regulations?
Yes. The system measures luminance (cd/m²), illuminance (lux), and chromaticity (x,y) in accordance with SAE J2631 and ECE R149. The LMS-6000F’s spectral resolution of 1.5 nm is adequate for evaluating the phosphor coatings on white automotive LEDs, ensuring color bins remain within the required white box on the CIE 1931 diagram.
Q4: What is the typical calibration interval recommended for the LMS-6000F?
LISUN recommends annual recalibration using a certified spectral irradiance standard lamp. The instrument’s stability over one year is typically within ±3% for absolute irradiance and ±0.5 nm for wavelength accuracy, provided it is stored in a controlled environment (15–35°C, <80% RH).
Q5: Can the LMS-6000F generate a TM-30-18 color fidelity report for studio or medical lighting?
Yes. The bundled software computes Rf (Fidelity Index) and Rg (Gamut Index) per the IES TM-30-18 method. For medical lighting applications, the system also calculates the Melanopic Ratio and Circadian Stimulus (CS) metric according to the WELL Building Standard.
 English
  Spanish
  Russian
  Portuguese
  Turkish
  Arabic
  German
  Polish
  Italian
  French
  Korean
  Japanese
  Indonesian